
Vermont Agency of Transportation
Building the Vermont Resilience Planning Tool
We developed an interactive resilience planning tool to help the Vermont Agency of Transportation identify infrastructure vulnerable to flood damage. By integrating geospatial data and risk assessment models, the platform streamlined decision-making, enabling proactive mitigation efforts. These improvements enhanced emergency response planning, optimized resource allocation, and contributed to a more resilient transportation network in the aftermath of Tropical Storm Irene.
My Role: Competitive Analysis, Wireframing & Prototyping, Front-end Development
Project Time: 22 months
Recognition: 2018 Grand Award, American Council of Engineering Companies of Vermont; 2018 GIS & Data Science Project of the Year, Vermont Center for Geographic Information

OVERVIEW
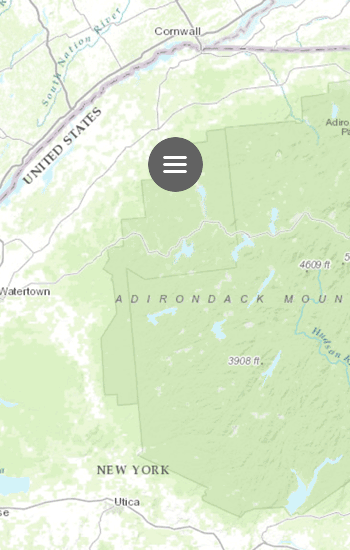
Hurricane Irene
The Vermont Resilience Planning Tool (TRPT) was developed in response to the widespread damage caused by Tropical Storm Irene in August 2011 and the increasing frequency of local infrastructure failures due to flooding. In the aftermath of the storm, the Vermont State Agency of Transportation prioritized enhancing emergency response and recovery efforts to restore transportation networks more efficiently. Recognizing the need for a proactive approach, the TRPT was designed to identify high-risk infrastructure vulnerabilities—helping to prevent or mitigate future damage in the most critical locations.

DISCOVERY
Navigational Patterns
I conducted in-depth research on map navigation patterns, analyzing data-rich mapping applications to identify usability challenges and opportunities. This evaluation helped me assess established design conventions while uncovering innovative ways to improve navigation, data accessibility, and user interaction.

UI Design
I designed high-fidelity wireframes in Adobe XD, iterating through multiple design solutions in collaboration with the project team and stakeholders. To enhance usability and data accessibility, I conceptualized collapsible menus and floating task windows, allowing users to efficiently navigate and interact with large volumes of critical information.
Map Animation
Static wireframes often fail to convey movement and interaction, which were essential to the innovative user experience I aimed to create. To bridge this gap, I developed an animated, clickable prototype using Sketch, Principle, and Adobe XD. This prototype effectively demonstrated the ease and flow of interactions to stakeholders while providing developers with a clear understanding of the design’s feasibility and technical implementation.

Tweed River
Tropical Storm Irene exposed the erosion vulnerability of Vermont Route 100, where the Tweed River’s high-velocity flows carved through road embankments, causing severe structural damage. Without adequate floodplain access, the rushing water gouged deep holes, leading to the failure of small culverts and bridges. This devastation underscored the urgent need for proactive flood mitigation strategies, reinforcing the importance of the Vermont Resilience Planning Tool in identifying and addressing high-risk infrastructure.

Identifying & Mitigating Risk
The Vermont Resilience Planning Tool (TRPT) provides an intuitive, data-rich interface for quickly assessing flood vulnerability and infrastructure risk. As seen in this view, the tool visually highlights high and moderate-risk sections of Vermont Route 100 along the Tweed River, making it easy for planners to identify critical erosion threats.
Key risk factors, such as roadway overlap with the river corridor (1,464 feet), stream power (123 W/m²), and valley confinement, are displayed in a clear, interactive format, allowing users to assess damage potential at a glance. The asset risk panel quantifies vulnerability, while configurable storm scenarios enable real-time impact assessment under different flood conditions.
By centralizing and visualizing high-risk locations, the TRPT empowers decision-makers to proactively prioritize mitigation efforts, ensuring Vermont's transportation infrastructure remains resilient against future flood events.

Flood Resilience in Action
Using insights from the Vermont Resilience Planning Tool (TRPT), a targeted mitigation plan was developed to protect Vermont Route 100 while reducing erosion along the Tweed River. The approach focused on restoring natural river dynamics to improve long-term stability.
Key interventions included:
✔ Bed armoring to elevate the channel back to pre-flood levels and reconnect the floodplain.
✔ Bank reshaping to pull back oversteepened armoring that had encroached into the river channel, restoring proper channel width.
✔ Slope stabilization with carefully re-installed bank armoring at a shallower grade, reducing future erosion risks.
✔ Riparian vegetation restoration, with seeding along the lower bank to promote natural stabilization.
✔ Erosion control measures to ensure minimal environmental impact during construction.
Four years post-installation, the project has proven highly stable, with the reconnected floodplain functioning as intended—successfully absorbing high flows and reducing future roadway vulnerability.
Reflections & Learnings
The Vermont Resilience Planning Tool (TRPT) was my first experience designing a data-rich mapping application, requiring me to develop custom Esri ArcEnterprise HTML/SCSS components. Integrating these with an unfamiliar service presented a significant challenge, but collaborating closely with experienced Esri ArcEnterprise developers helped streamline the process—making add-ins, overrides, and customizations much more manageable.
A key takeaway from my competitive analysis was the lack of innovation in map navigation patterns. Many designs follow what I call the "Google/Amazon Effect"—defaulting to familiar patterns from tech giants rather than pushing for new, more effective solutions. While this approach provides built-in affordance, it often results in homogeneous user experiences.
Through research, analysis, and testing, we designed a more intuitive and, at times, delightful set of map controls. These controls successfully encapsulated complex layers of data while ensuring users were not overwhelmed by information overload. The result was a tool that made critical flood risk data actionable for transportation planners, enabling them to proactively mitigate infrastructure vulnerabilities.
🚀 Key Learnings:
✔ Customizing Esri ArcEnterprise components required close collaboration with developers
✔ Competitive analysis revealed minimal innovation in mapping UX patterns
✔ Balancing affordance with innovation is key to improving user experience
✔ Layered data visualization can be made intuitive without overwhelming users
✔ Stakeholder alignment was essential in designing a scalable, effective solution
Awards & Recognition
🏆 2018 Grand Award – American Council of Engineering Companies of Vermont
🏆 2018 GIS & Data Science Project of the Year
This project reinforced my passion for solving complex UX challenges in data visualization and infrastructure resilience—ensuring that decision-makers can act with clarity, confidence, and impact.